Experiment Hotspot-Highlighting
General information:
The experiment is finished.
The participants were asked to give information on how experienced they are with modeling SCCharts and modeling and programming in general.
The participants were given an SCChart model in Kieler together with a timing specification for the maximal worst case execution time of the model. The model in its given form does not meet the timing specification and it is the task for the participant to revise the model such that the timing specification is met. To be able to do that the participant will receive a list of alternative library functions for the host code calls that are included in the model. To replace function calls by calls to the respective alternative functions is the only change that is allowed to solve the task. However it is allowed to change the model temporarily, especially by commenting out parts of the code, but the outcome must be the same model (semantically as well as syntactically) with the exception of a number of swapped host code calls.
The participants will be devided into groups that will work with KIELER versions with different degrees of interactive timing support. We will measure the time it takes for each participant to solve the task as well as the number of call replacements. We will also document the final state of the model.
Here is a small example to illustrate the work process (please note that the actual model for the experiment will be somewhat larger than this example!):
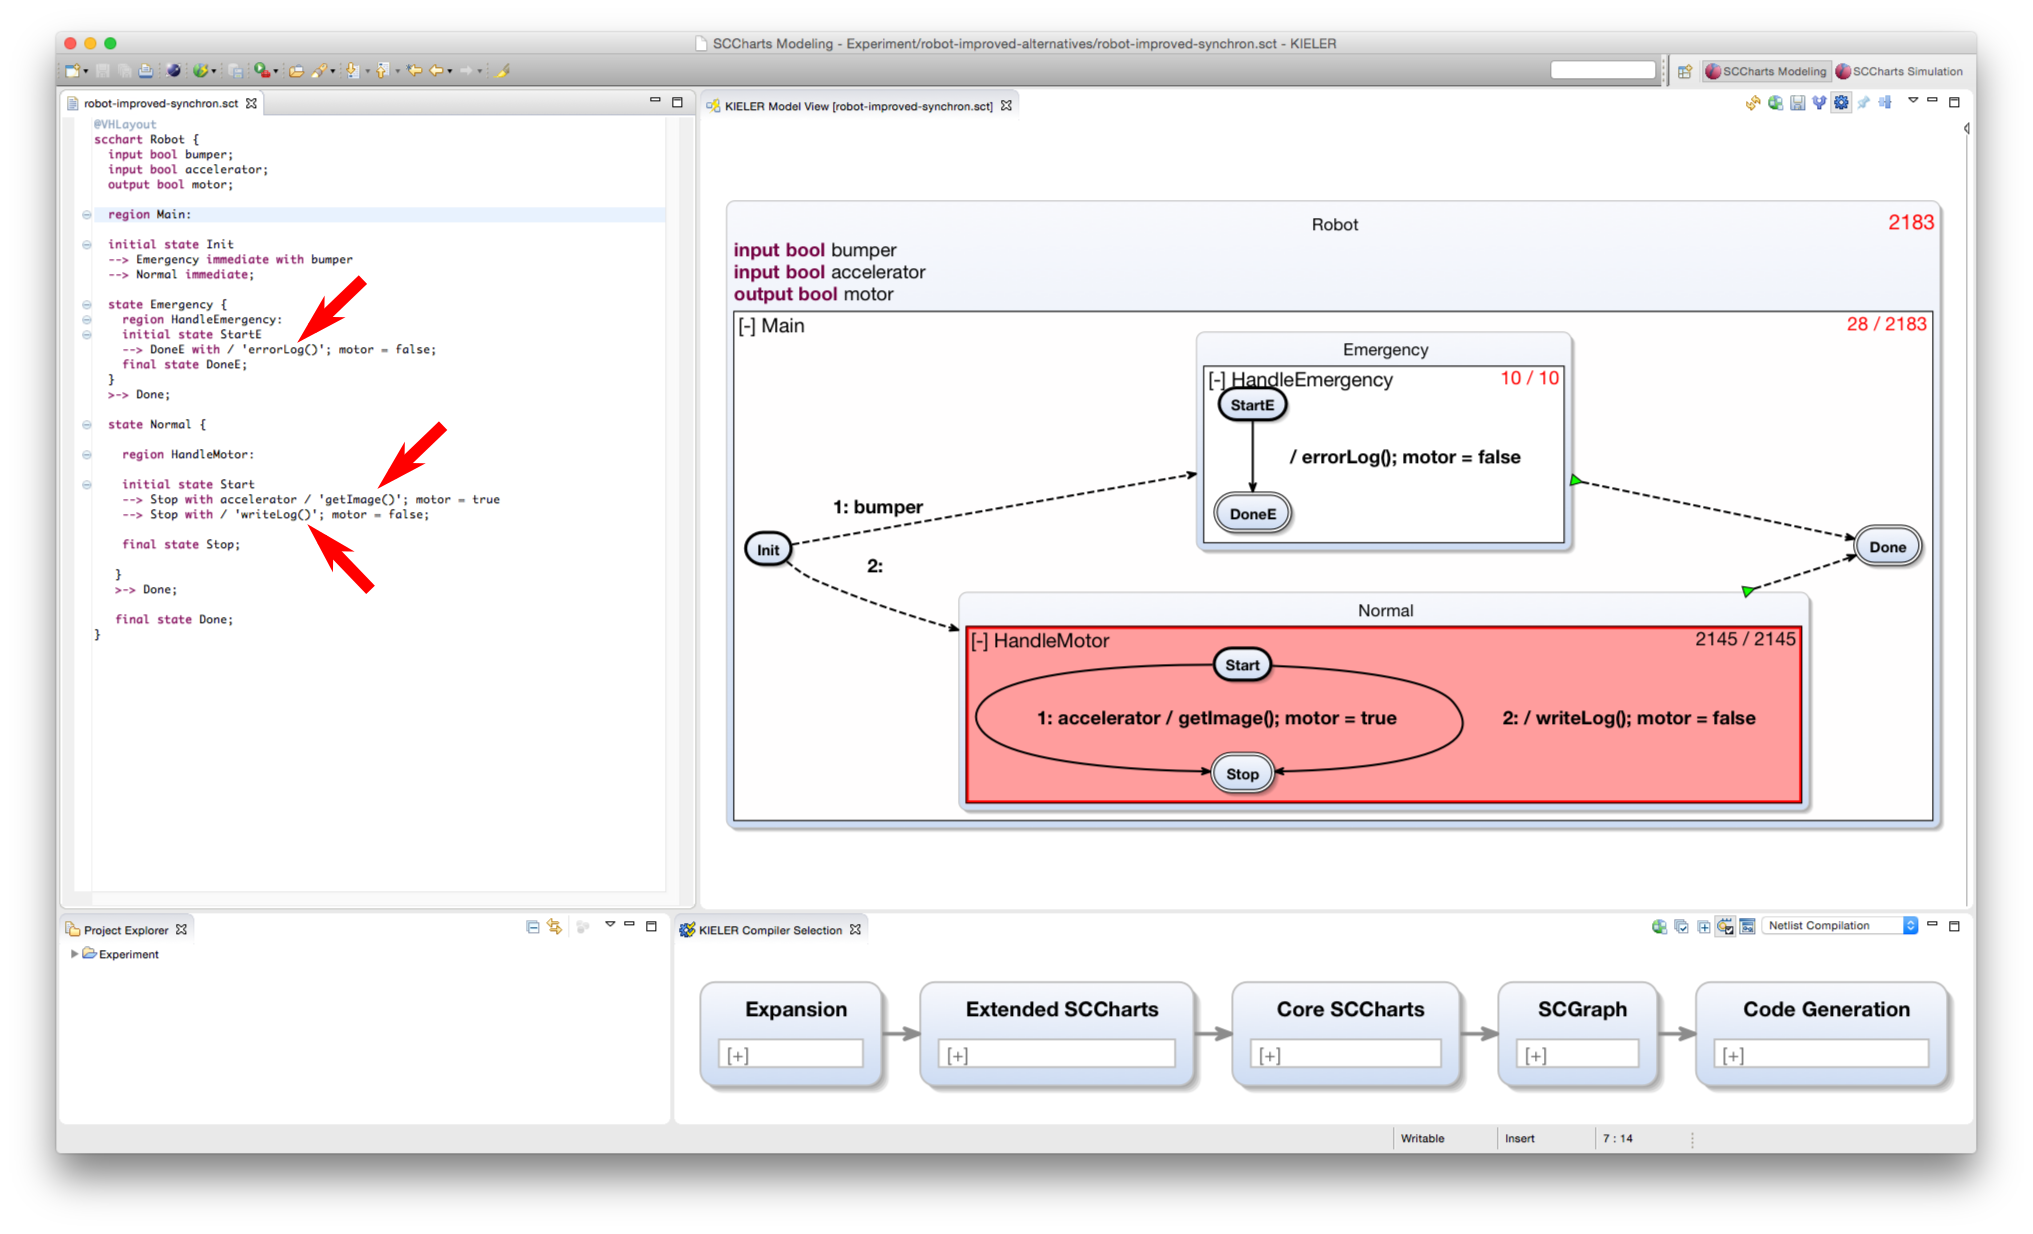
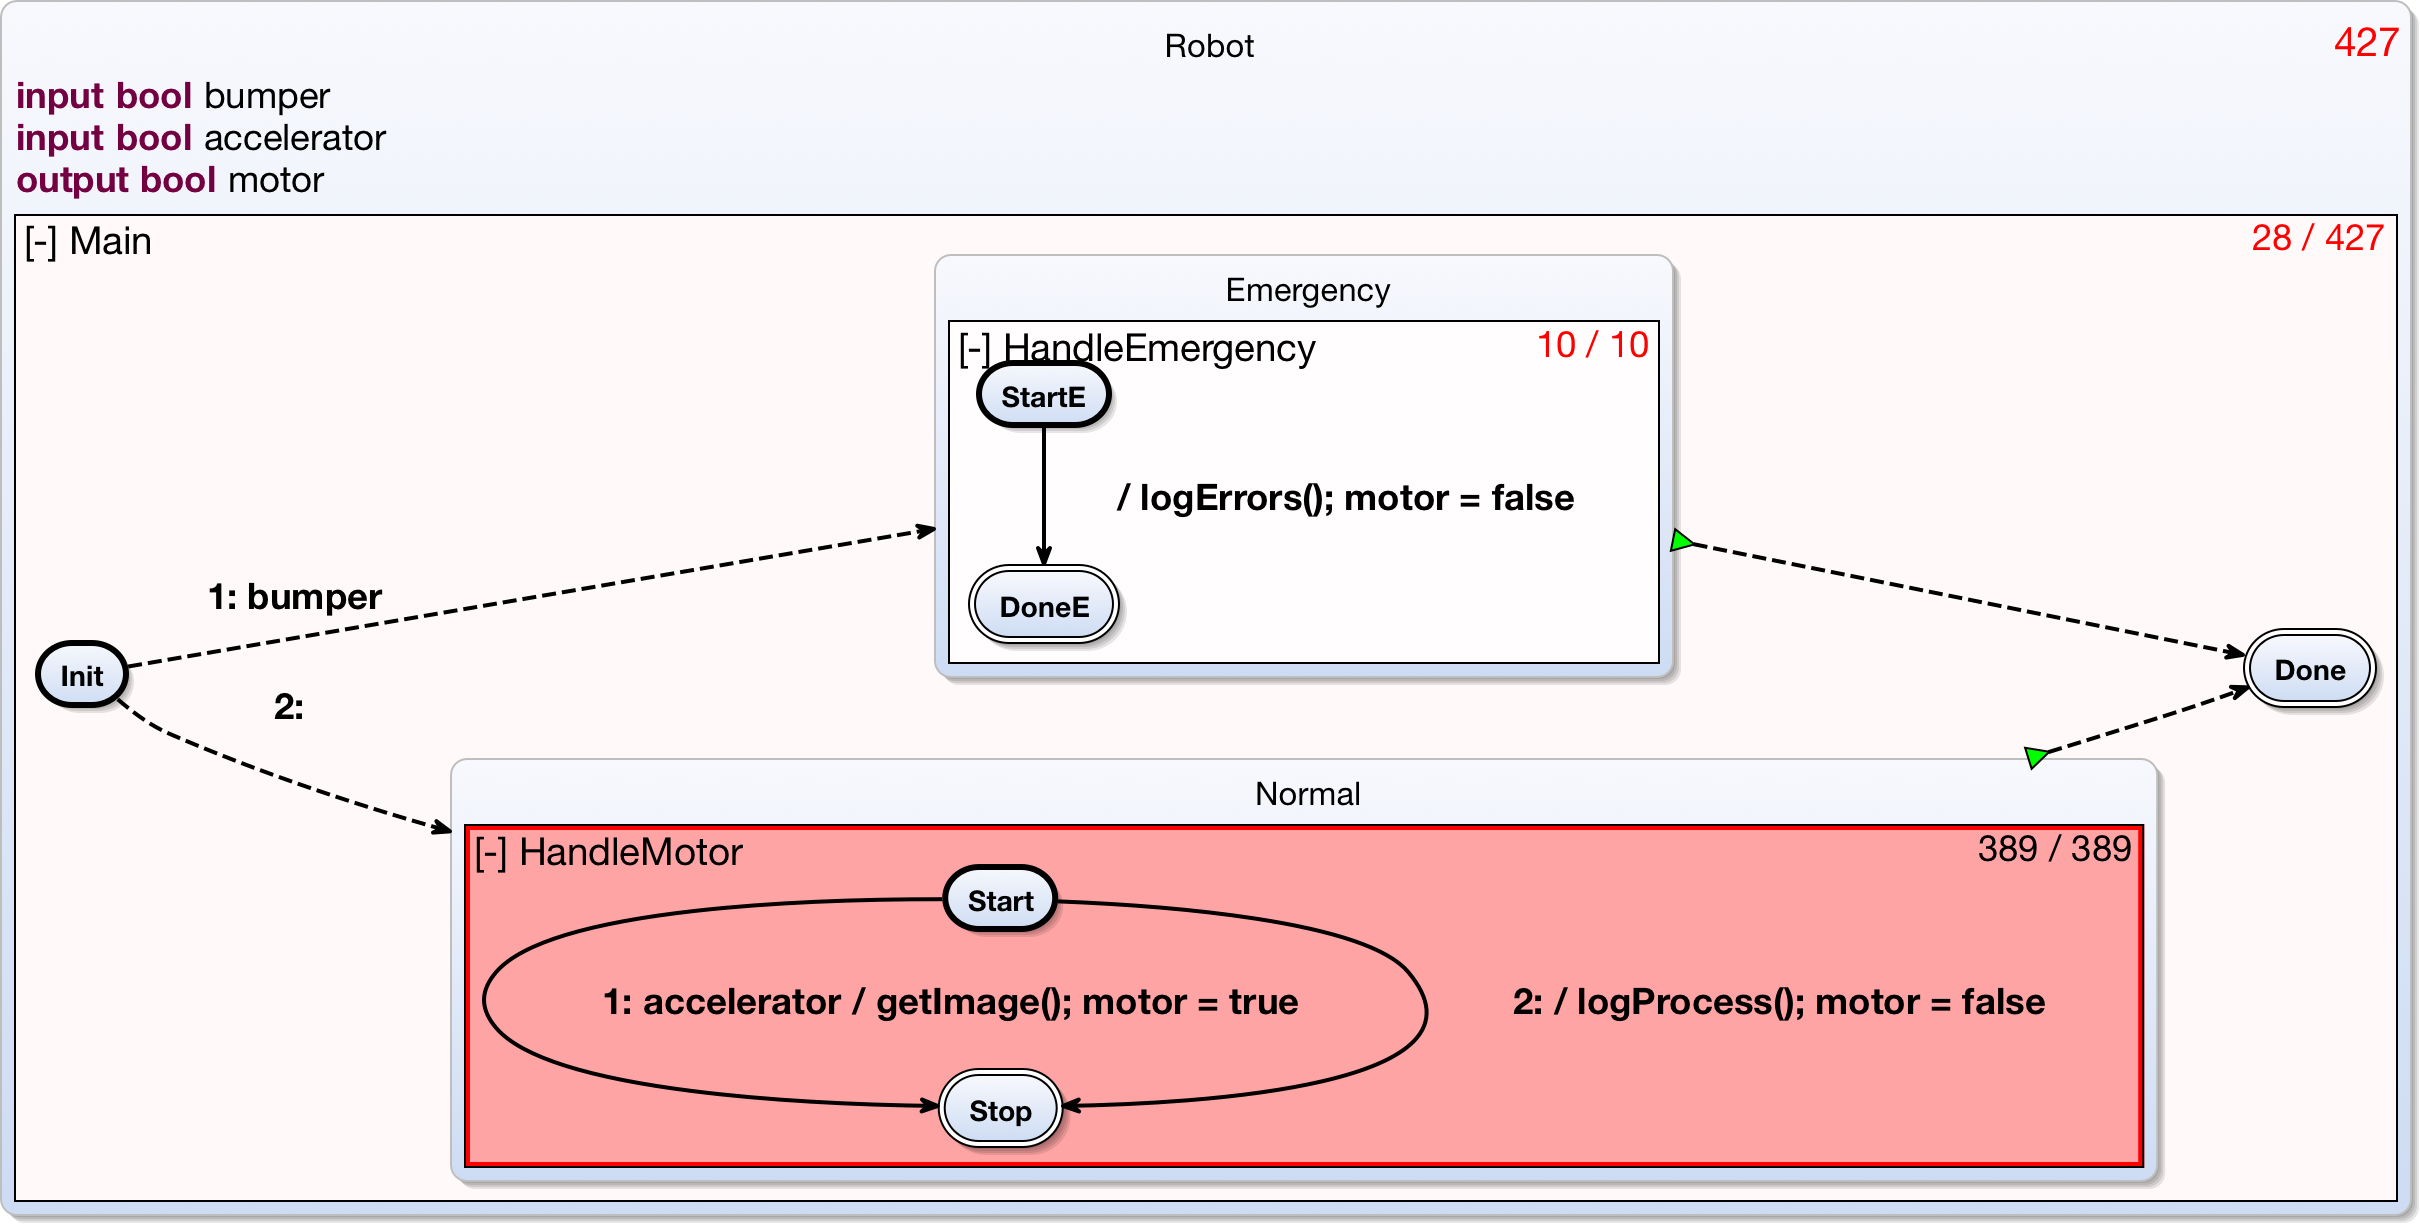
In a KIELER instance we get a given model:

We are in a group that works with interactive timing analysis that offers the overall timing value in the right upper corner of the model state ("Robot"), it is 2183. Also we get timing values for all three regions in their right upper corners. The first of the two timing values in each case denotes the share of the overall execution time that relates to this region, without its included child regions. The second timing value takes the child regions into account additionally. For example, the total execution time is spent in region "Main", but only 28 time units on the uppermost level, the rest is spent in the child regions. In addition to the region time values, the KIELER instance offers hotspot highlighting, which means here that the regions will be colored in different shades of red, which are related to the share this regions has of the overall execution time. For example in this case, about 98 percent of the overall execution time are spent in region HandleMotor, which is why it has a rather dark shade of red, while the other regions are almost white.
In addition to this model we get a sheet with information on alternatives for the host code calls in the model and with the specification on the maximum overall worst case execution time we want to acchieve:
Maximum Worst Case Execution Time: 500 tu
errorLog() / logErrors()
writeLog() / logProcess()
getImage() / takePicture()
Note that we get no information, on how long those function calls might take. The alternative might be better or worse than the original.
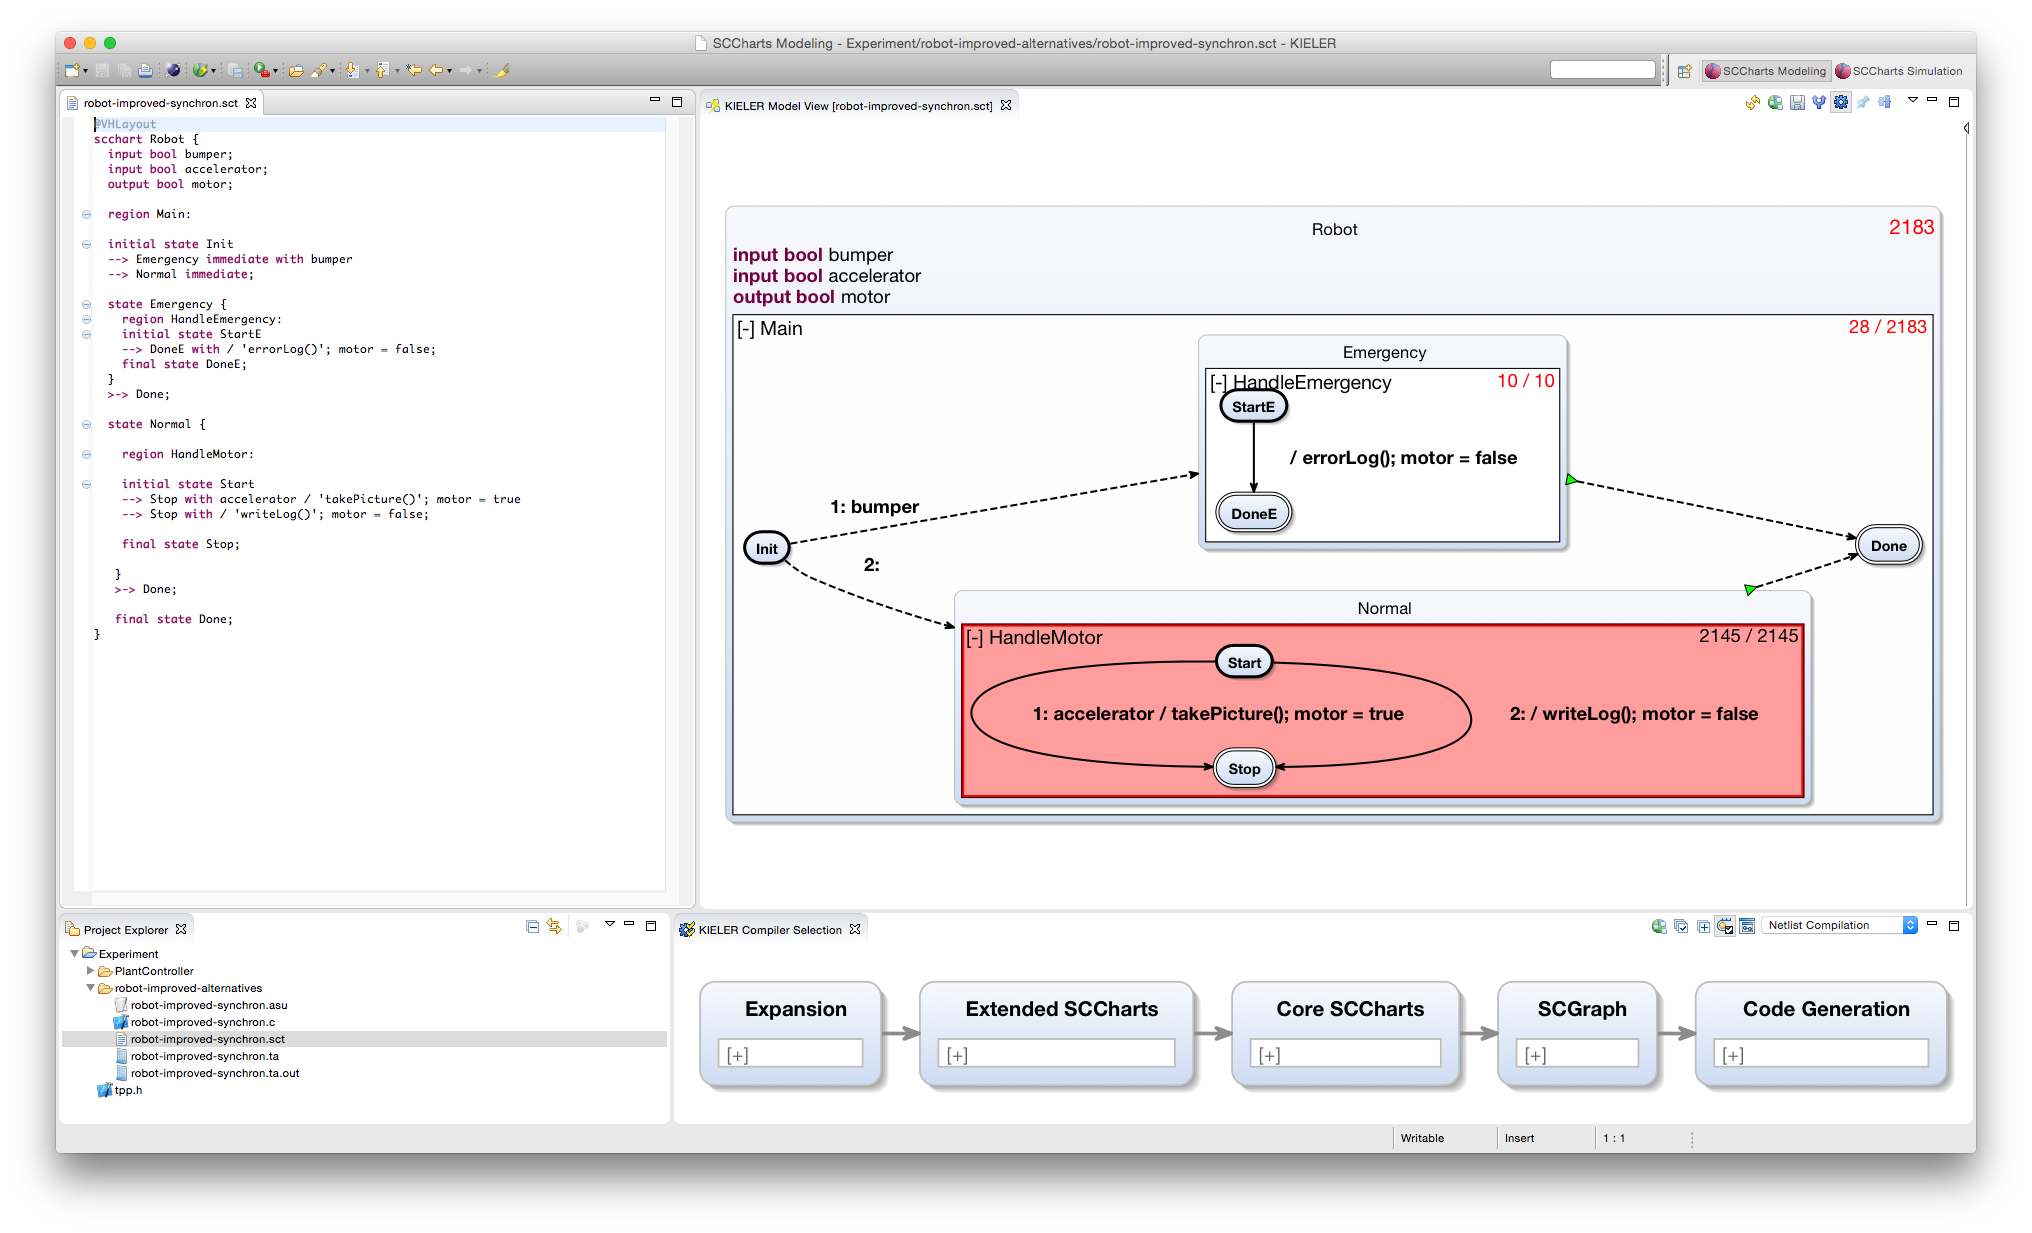
Now we can start to swap host code calls in the textual code to revise our model:
Suppose we decide to exchange the call to getImage() with a call to takePicture(). Then we will find that the time values do not change at all:
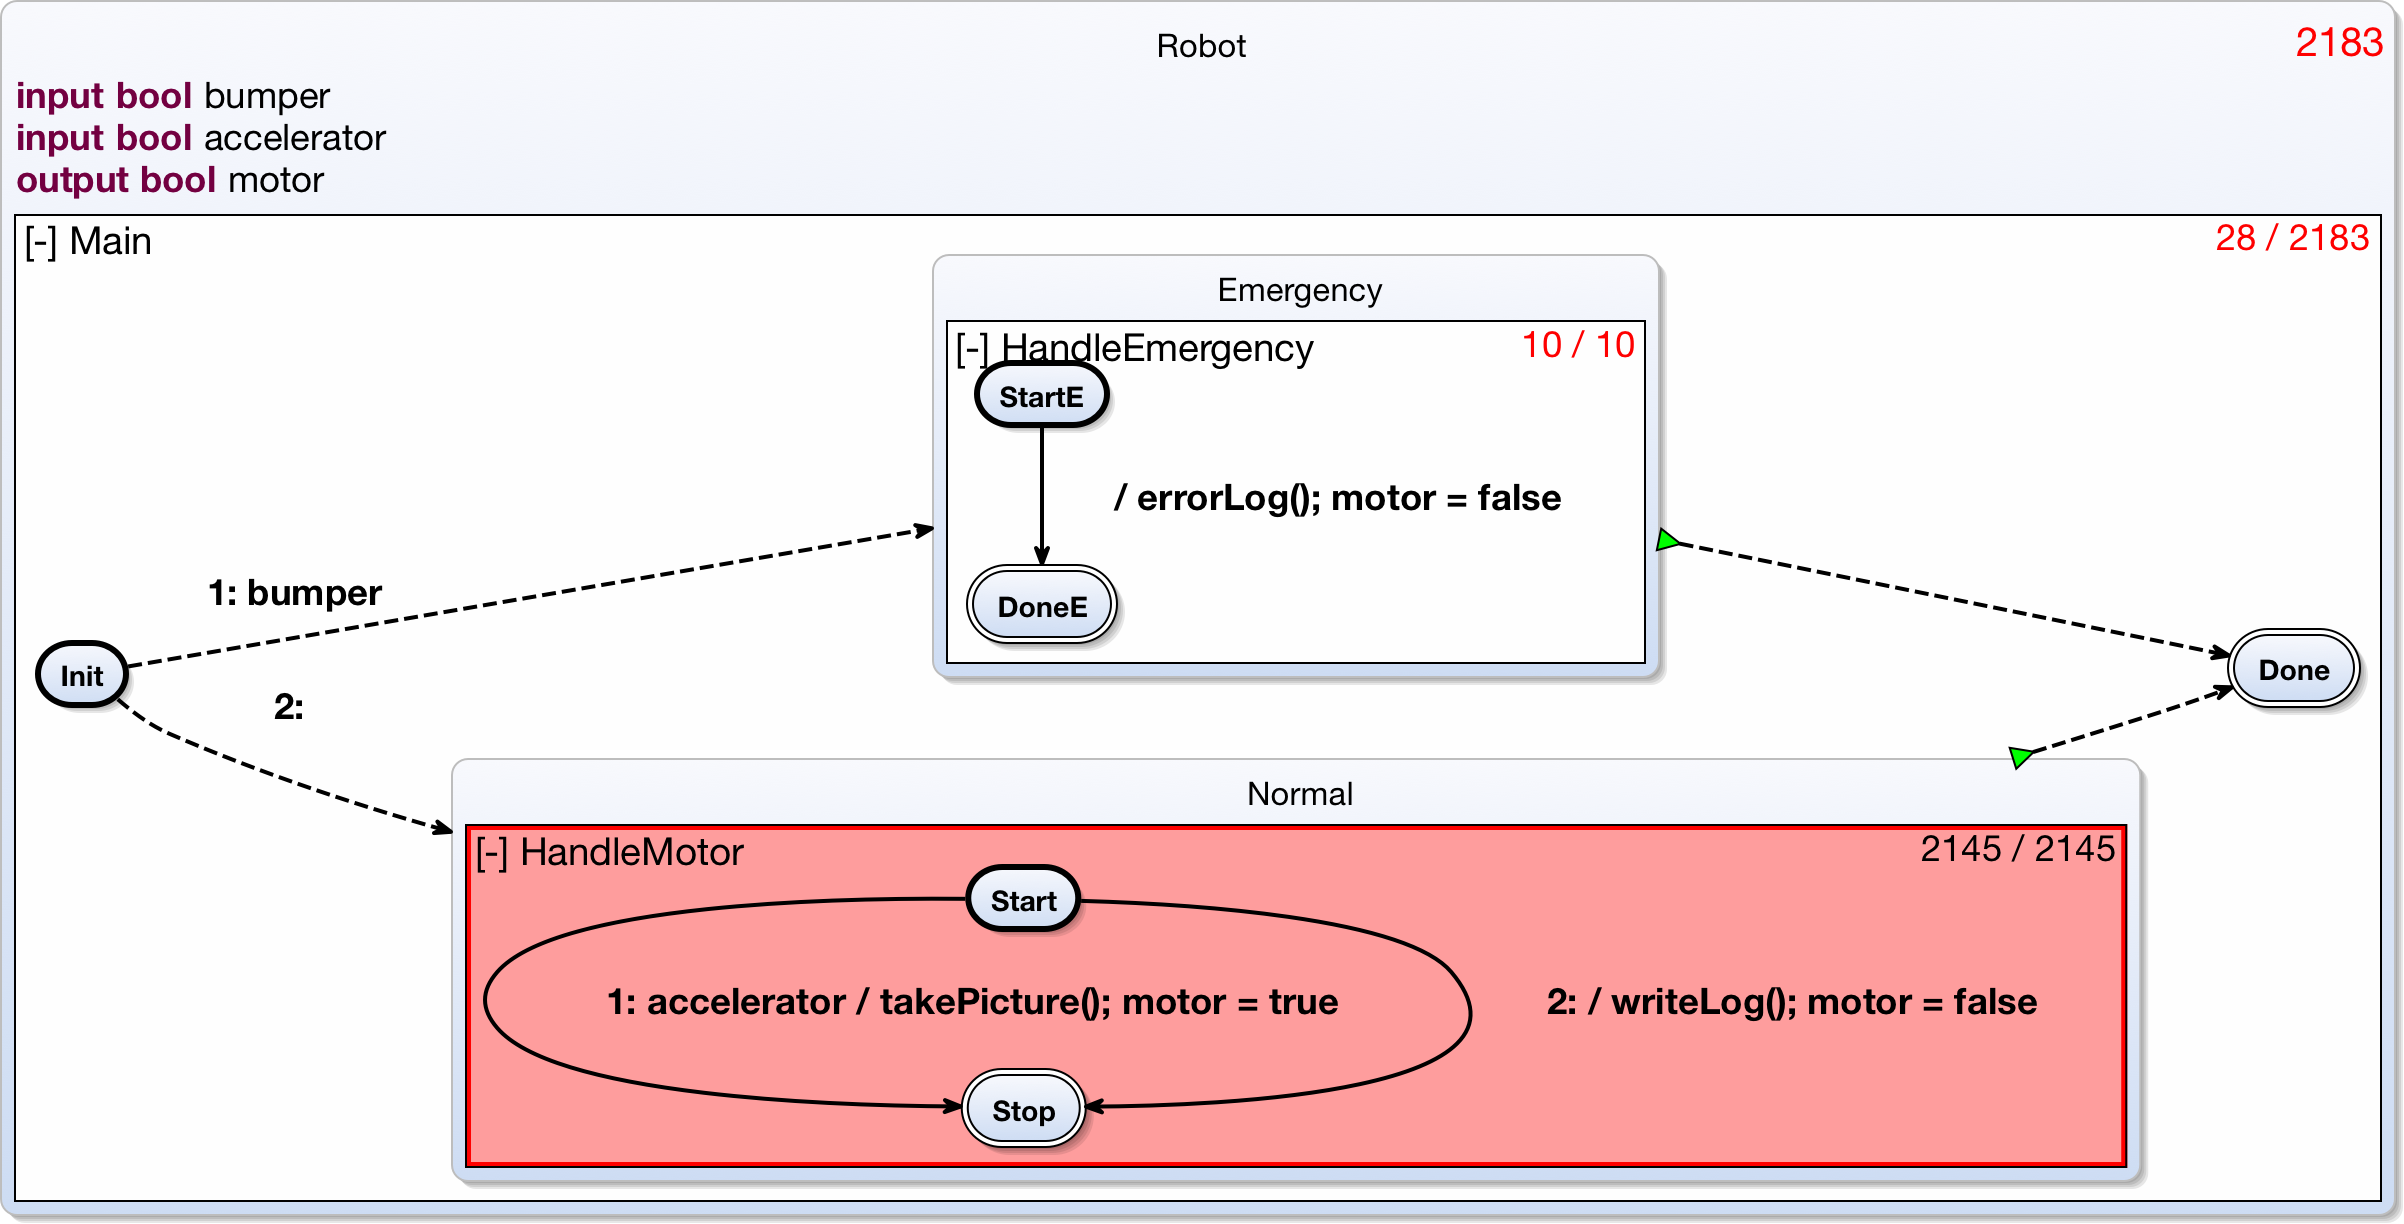
We can deduce that either getImage() and takePicture() take exactly the same amount of time (which is unlikely) or in worst case the transition with the second priority in HandleMotor is taken (accelerator not true). writeLog() is executed, but not takePicture() (and also not getImage() before). Therefore, exchanging getImage() for takePicture() does not show any effect.
So let's change writeLog() to logProcess() then:
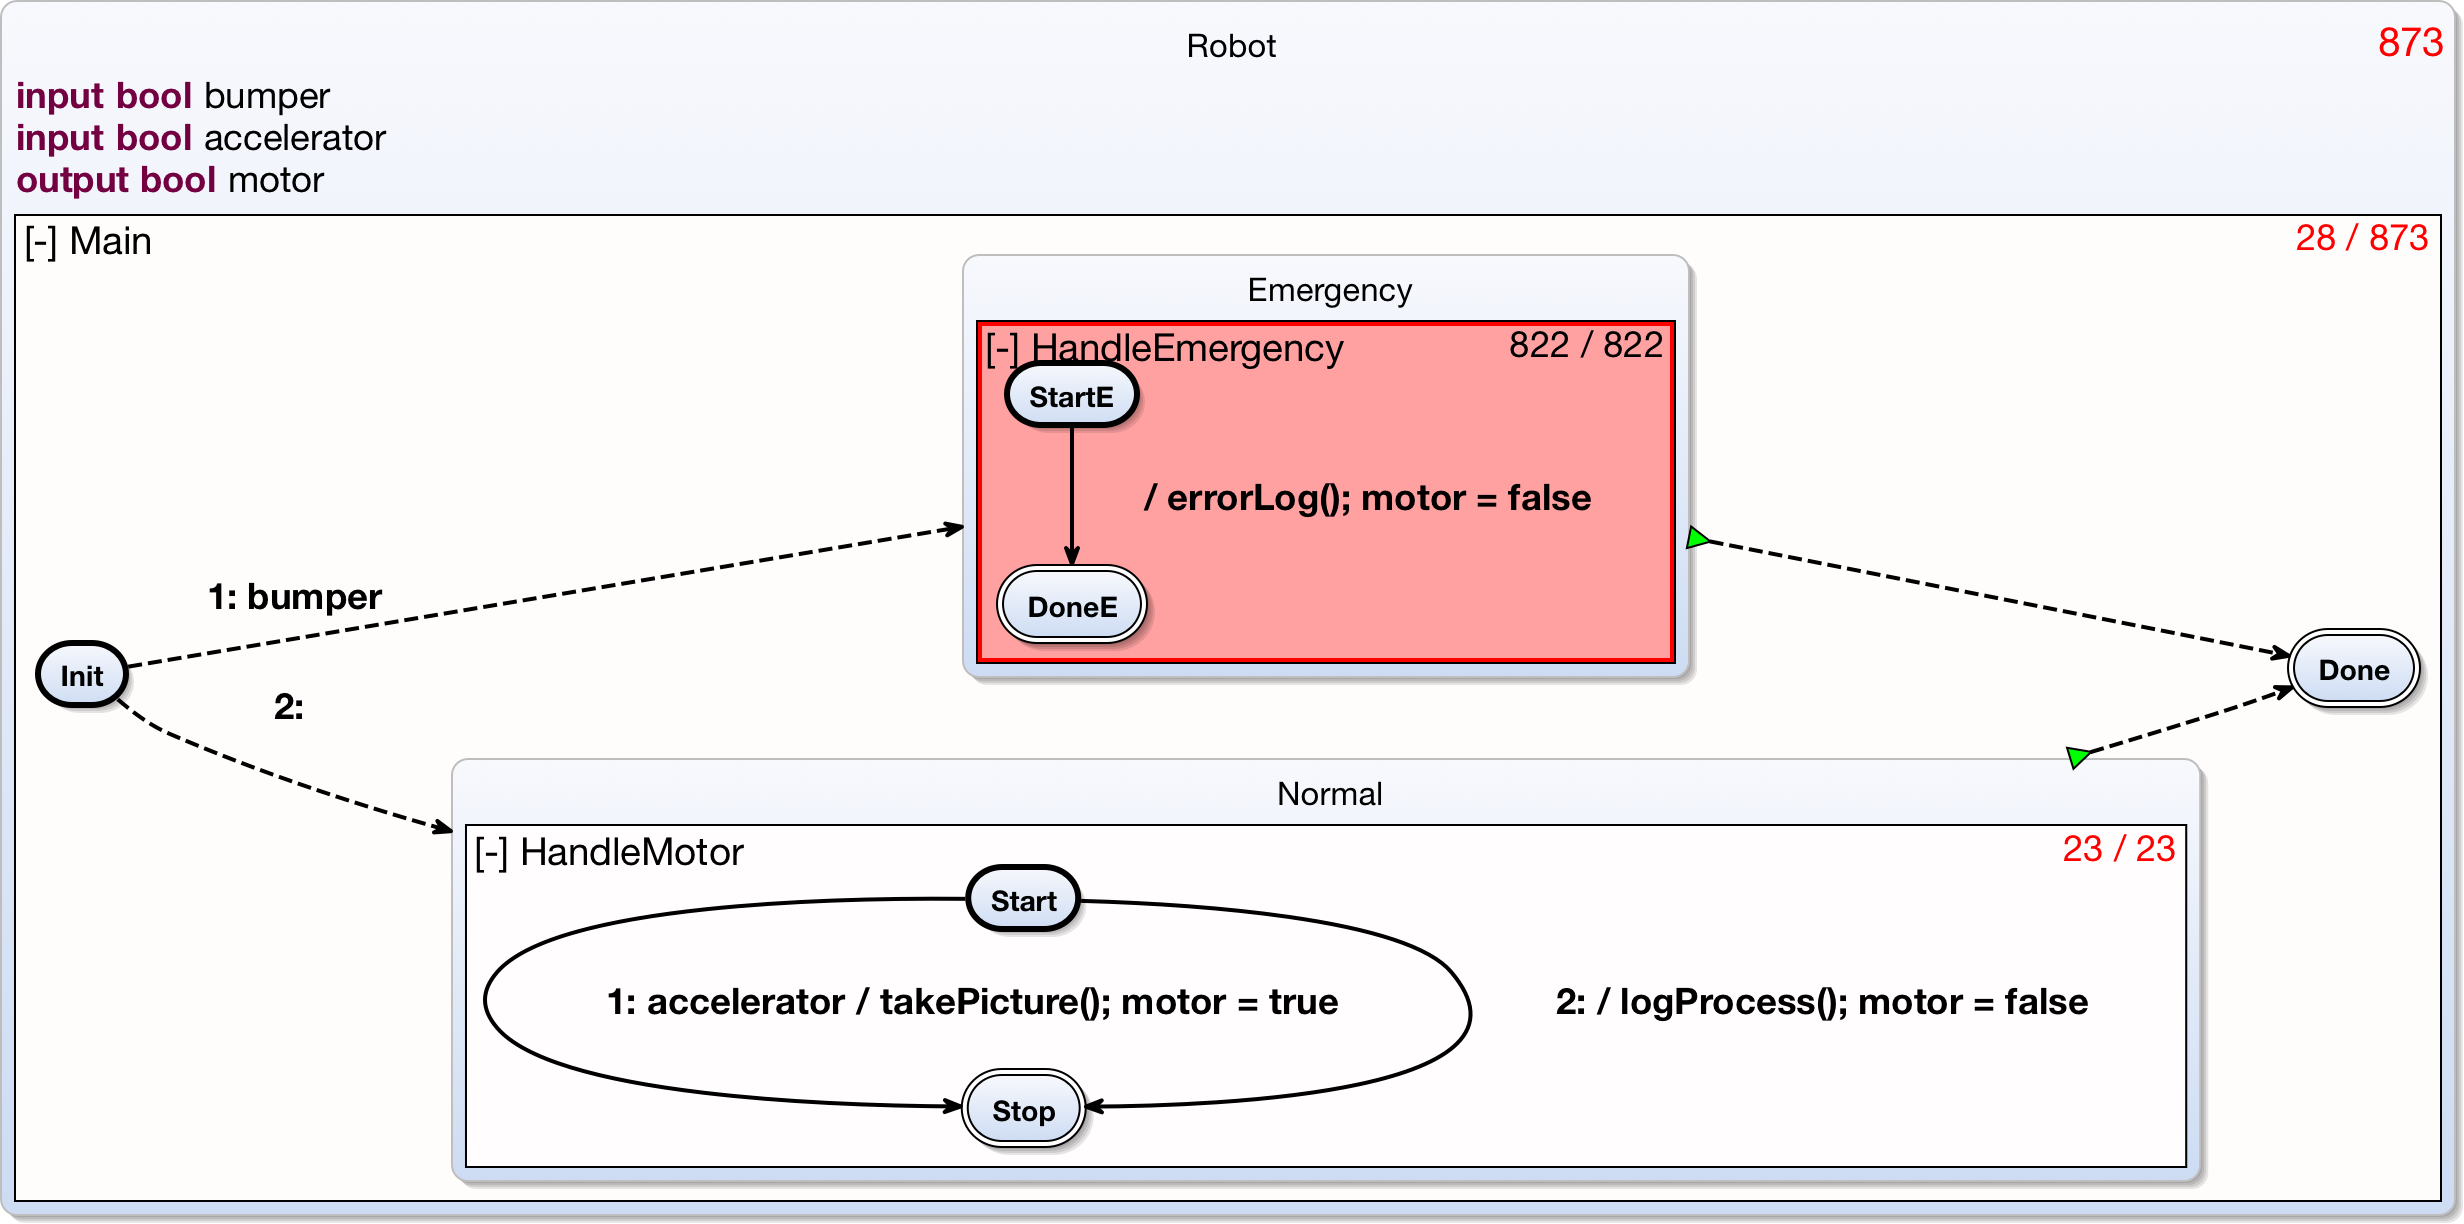
Now quite a lot has happened: First of all, we have reduced the overall worst case execution time. The decision to replace writeLog() with logProcess() seems to have been a good one. We are not done however, as we have to get below 500 tu. Second we can see that the worst case execution path has switchend and now HandleEmergency is the most time consuming region of the model. This means that errorLog() must take longer than either takePicture() or logProcess(). So now we exchange errorLog() for logErrors():

Now that was successful as well, as the overall worst case execution time is reduced again. Also, the worst case path has switched back to the HandleMotor region. That means that either logProcess() or TakePicture() take longer than logErrors(). As we already know we can only make logProcess() worse by exchanging it for writeLog(), we will now choose to change takePicture() back to getImage(). For, though we were not able to see the effect before, because writeLog() was even worse, we made a bad decision in the beginning by choosing takePicture() over getImage(). So let's revise this:
And now we have done it! The overall worst case execution time is finally below 500 and we are finished!
Note that if you get to be part of another group, then maybe you will get only the overall worst case execution time value, or the overall value and the region values, but no hotspot highlighting, respectively.